
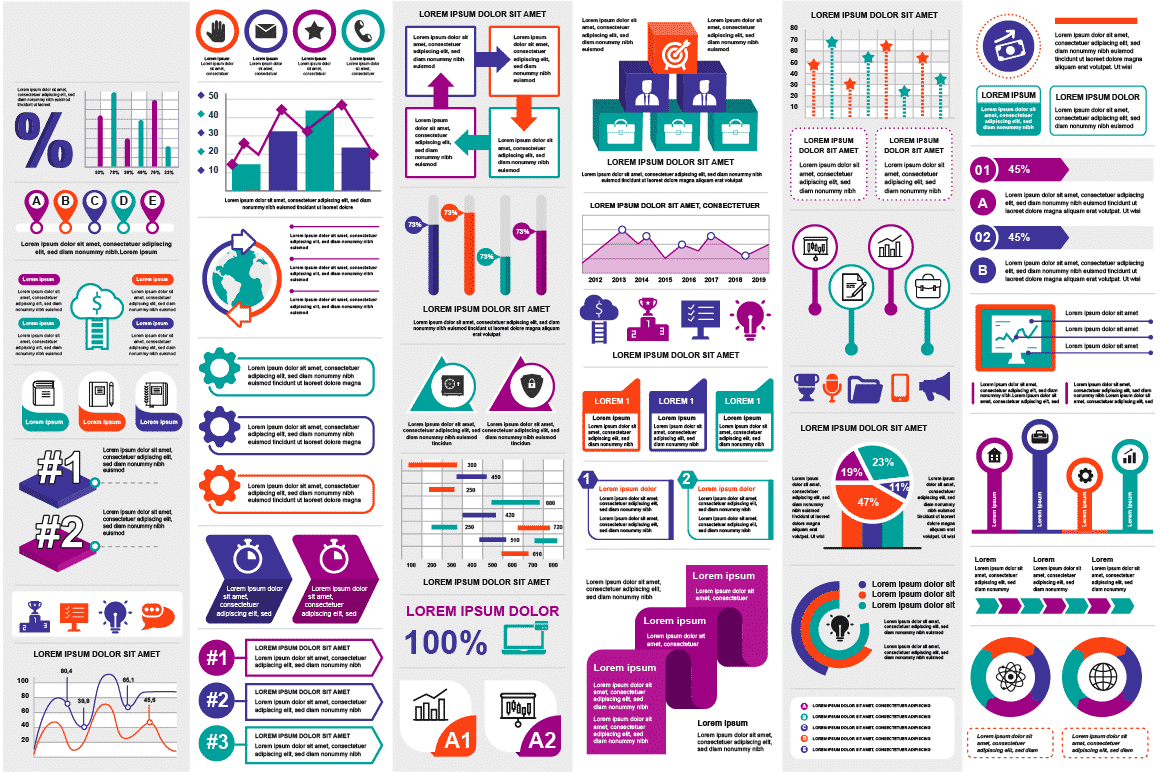
Today we’re going to take a closer look at what an infographic is, what it’s used for, and how to make the most of it.
Infographics are a fantastic tool for communicating complex messages in a clear and practical way. They are characterized by visual data presentation and show great potential for any marketing strategy.
Since their appearance, they’ve become an essential communication resource. And today, visual content dominates. So if you want to learn more about what an infographic is and what it’s used for, keep reading.
What is an infographic?
An infographic is a visual representation of data that conveys a message in a different, dynamic way. It’s a very effective communication tool since the human brain processes and remembers images more easily than plain text.
Infographics aim to simplify content to make it easier and quicker to understand by using a combination of images, charts, and text to create visual impact.
What is it used for?
Infographics help communicate content clearly and directly across different platforms, such as websites, posters, social media, brochures, and more. Now that you know what an infographic is, here are some common purposes for using this powerful format:
- To explain a complex topic or procedure
- To grab users’ attention
- To improve a marketing strategy
- To increase website traffic
- To boost the visibility and reach of your products or brand
- To generate engagement on social media
- To serve as an educational or presentation resource
- To raise awareness about a situation or issue
- To compare different processes
- To display research findings
Types of infographics
There are many types of infographics, depending on their purpose, format, or intent. However, they can generally be grouped into three categories:
- Static: Information is presented in a fixed format, often as a single, well-organized layout.
- Dynamic: Presented in video format.
- Interactive: Designed to encourage user interaction.
Elements of a good infographic
Creating an infographic involves more than just visuals — the goal should be to make an emotional connection with the audience. To achieve that, keep these key elements in mind:
- Content: It should be high quality and relevant to your audience.
- Title: Make it creative and attention-grabbing to encourage reading.
- Branding: Include contact info, sources, logos, etc.
- Design: Use a clear structure adapted to your audience’s needs and comprehension level.
5 tools to create infographics
Today, there are plenty of easy and intuitive tools to create infographics — even if you’re not a designer. Here are some of the most popular ones:
Piktochart
Piktochart makes infographic design simple by offering customizable templates. Once you upload your data, you can tweak the design and color palette. It’s a great way to get familiar with design. The free plan allows up to five visuals, but you’ll need a paid plan to remove the watermark.
DesignCap
DesignCap is a free and easy-to-use infographic maker with a wide variety of templates (though some premium ones require payment). It offers icons, illustrations, stock images, and the ability to upload your own. The free plan allows five JPG exports, while the basic plan ($4.99/month) gives unlimited access to high-resolution exports in PNG and PDF.
Canva
Canva is a well-known design tool perfect for everything from flyers to presentations — and yes, infographics too. It provides a huge library of images, icons, fonts, and design tools. You can use it for free, with plenty of free design elements, and access premium content for around $1 per item.
Infogram
Infogram is a fantastic free tool offering a wide selection of charts, tables, and maps, plus the ability to add images and videos. It uses a spreadsheet-style interface to input and edit data, which automatically updates the design.
Once done, you can publish your infographic on Infogram’s site, embed it on your own website, or share it on social media. Pricing ranges from a free Basic plan to Pro ($19/month), Business ($67/month), Team ($149/month), and Enterprise (custom pricing). Annual billing includes a 24% discount.
Adobe Spark
If you want to create infographics quickly for social media, Adobe Spark is ideal. It includes over 10,000 templates and thousands of royalty-free images to enhance your designs.
Its drag-and-drop editor starts with a preset template — just browse, select one, and begin editing. You can add backgrounds, change text, insert icons, and even include your logo. Once your design is finished, you can resize it for the desired social platform and download it to help it go viral.
Be sure to try them out, and let us know what you think! 😉